Electric guitar pickups convert string movements into an electrical signal that can be heard through an amplifier. They come in many different designs, and have different electronic characteristics that give each pickup a different sound. It is possible to make meaningful measurements that will reveal almost everything you need to know about a pickup, using a computer with a good digital sound interface, and a few simple electronic circuits that are easy to home brew.
There are five essential components to my system:
-
Laptop with Scarlett Focusrite 2i2 digital sound recording unit
-
Rightmark Audio Analyzer software (freeware)
-
magnetic exciter probe.
-
Resistive/capacitive load networks
-
Input integrator circuit
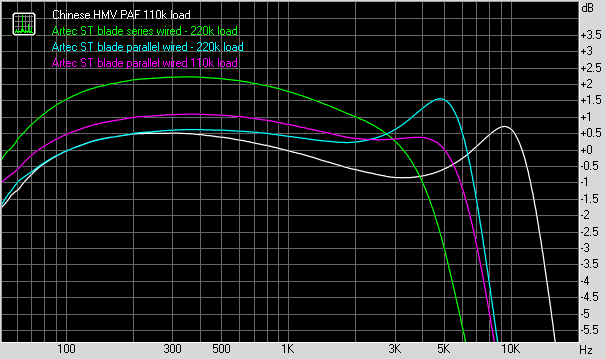
Fig. 1: Some features of these pickups can be seen here – series vs. parallel, the effects of different loading
The Rightmark software is an audio generator/analyzer. It sends test audio to the sound output of the computer, in this case, the output of the Focusrite box (I use the headphone jack on it). When the software is running tests, it monitors and records audio from the input, analyzes it and has the capability of generating graphs of the results.

Fig. 2: The probe can be positioned between strings on the guitar if necessary.
The exciter probe consists of a small coil of wire. It was salvaged from a dead flourescent lamp ballast. The coil is wound on a plastic form that was part of an inductor. The ferrite E cores that surrounded it were easily removed. Its DC resistance is about 5 ohms and it measures about 1cm cubed. It is fed through a 100 ohm resistor, in order to provide a current feed, instead of a voltage feed. The ratio of resistance to inductance is high enough that the frequency response is essentially flat from 20Hz to 20KHz. The reason for not using a voltage driven coil of large inductance, is mainly that such a coil, in practice, must have a permeable core which will interact with the device under test and skew the measurements by increasing the inductance slightly. This probe contains no magnetic materials and so should have little effect on the readings. The coil and parts are tie wrapped to a popsicle stick for convenient positioning during tests.
Different resistive/capacitive load networks are used, depending on which tests are being performed. The most basic is a 10:1 resistive divider that functions both as a

Fig. 3: Basic Measurement Circuit
normal resistive load for the pickup, and as an isolator to prevent the test cable and sound interface input from loading the pickup. For the inductive measurements, a capacitor is placed directly in parallel with the pickup. For the purpose of recording performance curves, it is better to use the integrator circuit because it shows the frequency response more faithfully.
By running a few sweep tests in Rightmark, nearly all of the important information about a pickup can be measured – the resonant frequency, inductance, capacitance, and also the frequency response. I use a spreadsheet to perform the mathematical calculations.
In operation, Rightmark first generates a 1kHz calibration tone at the audio output. At the same time, it measures and displays the input level. The output level is adjustable via the headphone volume control, and the input level can also be adjusted with the input gain control – all on the Focusrite. With some pickups it can be tricky to get adequate signal without distortion (also displayed by Rightmark). After some sweeps, I got warning messages about clipping, but I didn’t see anything crazy in the curves to suggest a major problem. When calibration is complete, you can run a sweep test.

Fig. 4: Results of a raw signal measurement – no integration. The lower curves are with a test capacitor in parallel, used to measure inductance.
Using only the raw signal from the voltage divider with most pickups, the result is a peak with a 6dB per octave slopes on either side. This fits theory perfectly, but requires some explanation about why it is not flat in the pass band. In fact, other researchers data does show a nominally flat signal in the pass band. It is because the probe they are using has a built in 6dB/octave loss due to being a voltage driven inductance. The pickup coil responds according to Faraday’s law of induction, where the output voltage is proportional to the rate of change of the magnetic field. A current driven probe produces a constant amplitude varying magnetic field, since the intensity of the field is proportional to the current. Then the induced voltage in the pickup coil is the derivative of the current, which rises at a 6dB/octave rate (since higher frequency waves have steeper slopes, for the non calculus aware reader).
Parameter Measurement Procedure
Measurement of the pickups two most important parameters, inductance and resonant frequency, are made easily with the Basic Measurement Circuit. First, the pickup is connected to the test circuit, and the exciter coil is positioned next to area of the pickup that is of most interest (in practice it makes little difference). The first step is to measure the inductance. For this, S1 should be closed to insert C1 in parallel with the pickup coil.
Run a sweep with Rightmark. This should generate a peak in the lower part of the audio spectrum, such as the ones in purple and green in Fig. 4. Record the frequency of the peak. Rightmark can be adjusted to narrow down the frequency range so that it is easier to read the exact value, if desired.
The inductance can now be calculated from the equation:
L = 1 / (2*pi*fc)2 / C , where fc is the capacitively loaded peak frequency
The value of C1 is much higher than the intrinsic capacitance of the pickup itself, and so it “swamps it out” and it can be ignored. Now open S1 to remove C1 from the circuit and run another sweep. This will generate another, much higher peak like the white and blue ones in Fig. 4. The frequency of the peak is just the unloaded resonant frequency of the pickup. Record this parameter.
Now the intrinsic capacitance can be calculated from:
C = 1 / (2*pi*fc)2 / L , where fc is the unloaded peak frequency
Equalized Response Curve Graphs
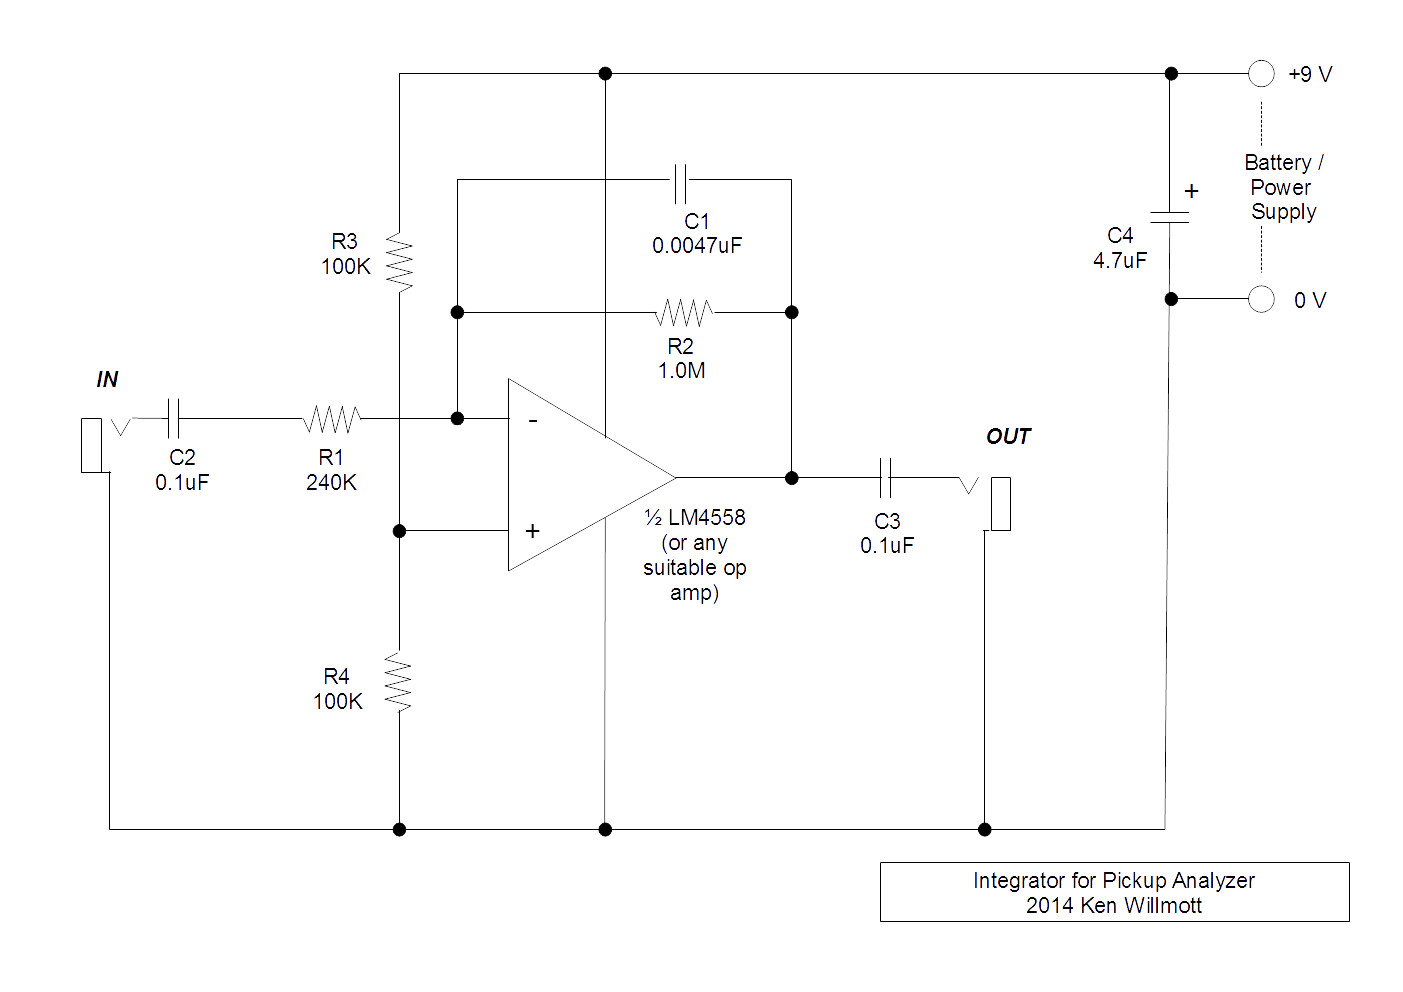
Fig. 5: Original prototype Integrator circuit to equalize for current driven exciter probe
Since there is an overall +6db/octave bias, the flat region in the pass band has a positive slope, and the stop region above the resonant frequency has a -6db/octave slope (since +6-12 = -6). In other words, in the case of a voltage driven probe, the rising slope and the falling slope cancel each other out. Therefore, I built an integrator to place in line between the pickup and the sound card, to eliminate the bias. This has two benefits – it makes the results read more intuitively, and it reduces the dynamic range of the sweep. The non-integrated signal is at the limit when measuring to 12kHz, because the signal gets quite big above that due to the rising slope.
Update 2016/09: I completed the design of a much better integrator circuit. 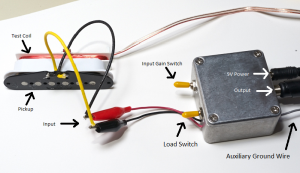 It has already been built and tested by myself and Andrew Flanders, who has been conducting similar research for a few years. It uses a Linear Technologies LT1058 or a Texas Instruments TL084 JFET op amp to achieve a very accurate integration function. It produces much better results than the plot shown in Fig. 6. The input has a built in high impedance preamplifier, which has very low intrinsic capacitance, hence does not interfere with the characteristics of the measured pickup very much. I used Eagle to design the PCB and had it manufactured by PcbWay. You can download the manual here: pickup_measurement_procedure
The electrical model of a pickup coil is well documented, and consists of a large inductance “L” with a distributed internal capacitance “C” and resistance “R”. The internal R determines the Q or “sharpness of resonance” of the tuned circuit of the L and C. However, the internal resistance is not the same as the load resistance, which in practice is the volume potentiometer in the guitar. Powered pickups like the EMG’s use an internal fixed resistor for this purpose.

Fig. 6: Here the effect of resistive load is very clear. Notice that this parallel wired pickup has an extremely good high end, but requires a low resistance load to be very flat. The scale is expanded to make small dB differences clear.
The complete circuit includes the pickup and load resistance, and any capacitance that is deliberately or inherently placed in parallel with the load. This circuit has the form of a second order RLC low pass filter, which has a loss above the cutoff frequency of 12 dB/octave. Conveniently, the degree of resonance or “damping” is a well understood phenomenon for this filter, and easy to calculate. This means that the value for the pickup resistive load (usually the volume control) can be tailored to achieve a desired degree of peaking or flatness, without any trial and error. For tests, it is desirable to use a very high resistance because the peaks allow a more accurate measurement of the resonant frequency.
It is tempting, and interesting, to run the tests on pickups while they are installed in the instrument. Although it is not possible to measure inductance and other pickup parameters this way, it can directly reveal a lot of information about the frequency response of the guitar electronics as a whole, including the operation of the tone controls.

Fig. 7: This is the whole test circuit, looking ugly now because it is built in air! At the top is the battery powered integrator. Magnetic probe is placed on the pickup. It’s a mess because I had no electronic bench in China
The (original) integrator is a standard circuit built around an LM4558 op amp. It allows essentially flat measurements from 100 Hz to 20 kHz. Since it has a -3dB cutoff around 32Hz, the response will show a -6db/octave roll off below that. From over 20 measurements of different pickups in different configurations, I discovered that all of them are flat within a fraction of a dB, below about 200Hz. Therefore, I concluded that it is not worth measuring, and that the 100 Hz value can be taken as a very accurate indication of what it it at, say, 20Hz. It is possible to lower the cutoff frequency of the integrator to include lower frequencies, by changing some resistor values.
This is a prototype and lacks conveniences, however I believe it shows that it is not very difficult to obtain measurements that are useful for installing, evaluating, or designing electric guitar pickups. Next I will explain how to interpret the readings and perform the necessary calculations to derive electrical specifications.
The main effect of a resistive load on a pickup, is to control the peaking at the maximum frequency that the pickup can reproduce. There are two ways to describe the amount of peaking.
One is called “damping factor”, which is sometimes labelled “k”. Values of k greater than one result in a minimum peak, and if much too large, result in a gradual, excessive signal loss at the maximum frequency. Values of k less than one result in a signal peak at the maximum frequency. It produces a strong resonance if k is very small. A typical guitar volume control provides a value of k = 0.5 or less, but I prefer to aim for a more flat response from k = 0.707.
The much more common way to describe peaking, is the Q factor. Q and k are related by the formula:
Q = 1/(2 * k)
Designing a Resistive Load for a Magnetic Pickup
An actual pickup was measured for this procedure. It is a Strat type single coil with steel pole pieces and a ceramic magnet. Instead of using a stock potentiometer and calculating the Q, we can choose a Q that we like, and find the replacement potentiometer value that will produce it.
1. Measure the inductance
The measured DC resistance is 6.2k.
With a 0.1uf cap in parallel with the coil, the measured resonant frequency is 400 Hz. Calculate the inductance:
fc = 1/(2*pi*(LC)0.5)
L = (1/(2*pi* fc))2 / C
L = 1.58 H
2. Now knowing L, we can calculate the coil’s intrinsic capacitance.
The measured self resonance frequency is 8500Hz.
C = (1/(2*pi*fc))2 / L
C = 222 pF
3. Calculate the load resistance to provide a Q of 1.8:
Q = R*(C/L)0.5
R = Q/(C/L)0.5 = 1.8/(222*10-12/1.58)0.5
= 152K ohms
- The stock volume potentiometer that was used with this pickup had a resistance of 200K ohms, so the actual value of Q can be computed:
Q = R*(C/L)0.5 = 200,000*(222*10-12/1.58)0.5 = 2.37
Note that these calculations assume that there is no load capacitance, such as a tone control or amplifier cable adds. If the volume control is at the maximum position, the cable capacitance is in parallel with the pickup capacitance and can be added to the calculations. When the volume control is at lower settings, the capacitance is decoupled from the pickup to some extent, and has less influence. The same can be said for the standard tone control, except that we accustomed to call the maximum the “lower” as it is lower in frequency (it has the maximum effect when it is turned down all the way). Changing either the cable or tone capacitance alters both the Q and the resonant frequency.
When the capacitance increases, the Q will increase, and the resonant frequency will decrease. So it is easy to see how a tone control will influence the sound. But if we are interested in the base conditions, it is best to estimate the situation when the tone control is at a maximum (thus mainly out of the circuit), and calculate values including the cable capacitance.
A typical cable capacitance is about 80pF/meter or 25pF/foot. Thus a 3 meter or 10 foot cable will have about 250pF of capacitance. The Strat pickup that we measured above had an intrinsic capacitance of 222 pF. Parallel capacitances add, so the total capacitance is 250pF + 222pF = 472 pF. Since we have almost doubled the capacitance, it will obviously affect the output audibly. Recalculating the Q with cable capacitance:
Q = R*(C/L)0.5 = 200,000*(472*10-12/1.58)0.5 = 3.46
This Q is quite high, but produces the tonal flavour that Strat pickups are well know for. It is not the focus of this section, but worth noting that the resonant frequency has dropped from 8,500 Hz to 5,830 Hz. It is obvious that in order to achieve the desired results, we have to include the cable capacitance in all the load resistor calculations. So, for example, with the Strat pickup, we wanted to achieve a Q of 1.8. Including the cable capacitance:
R = Q/((C+Cc)/L)0.5 = 1.8/((222*10-12+250*10-12)/1.58)0.5
= 105K ohms
An interesting outcome of this analysis is that once the Q for a given resistance, or the resistance for a given Q, are known, different values of Q or resistance are extremely easy to calculate because they are linearly related. A doubling of resistance will produce an exact doubling of Q. So if you are changing your volume potentiometer from 250K ohms to 500K ohms, you can expect an exact doubling of the Q, no matter what it is. In general:
Qnew = Qold * (Rnew / Rold)